
Fight Inflation For Yourself

There’s a way you can determine your personal inflation rate and once you do, it will set you free. I’m going to show you how to do just that and make yourself a tool that can help you survive inflation with a solution tailored specifically for you. This article is best viewed on laptop or desktop computer due to the data tables displayed. There is an excel file at the end of this article you may download. Let’s pinch the pinch.
Do you feel a pinch in your finances? The buzzword right now is “inflation”. “Inflation” is a term that has a specific meaning to economists and analysts but for this exercise let’s limit it to what matters to you – the amount of money you are seeing go out the door – or rather aren’t seeing go out the door but somehow isn’t there when you need it. And then we react.
Our immediate reaction can be “cut this, cut that” and then we wonder why it’s not helping at all. What I am about to show you will help you adjust for your specific household. Often advice we hear, see, or read is well intentioned but not tailored for us or our own household.
I am a firm believer that as a parent I am the only one who knows what’s going on in my household. When it comes to fighting inflation there is a lot of good advice on the news, social media, and in print but only you know what’s going on in your own home. So that’s where we start. I’d like to take credit for this methodology but the inspiration came from Sharon Epperson at CNBC.
“To figure out how much inflation is actually impacting your wallet depends on how much you are spending and where you’re spending it. You need to calculate your own personal inflation rate…Depending on your income, the impact of your personal inflation rate may feel better — or worse — on your wallet than the latest CPI number.”
(Epperson, May 2022).
I read this great article from the CNBC website, “How to calculate your own personal inflation rate amid rising prices” by Sharon Epperson. She shares how to see how this phenomenon is impacting you. I then began the work. And yes, this is work.
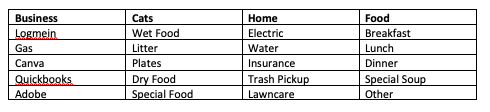
The work begins by opening Microsoft Excel (or Google Sheets…or Lotus 123 if you go super old school) and creating some heading and expense items. The first thing I did was create four “buckets” I thought my expenses fell into: Business, Cats, Home, and Food. These became the top headings. Then I listed out my actual expenses using Microsoft Excel below the headings I just created. It helps to have a working knowledge of how to create formulas to calculate sums and differences as well as format cells as percentages.
Then I logged into my online banking and did searches for each item, setting a date range of 18 months so I could see when prices changed. This is where two monitors, splitting windows on a single screen, or using a tablet / phone to review statements while entering data on the main screen. I then listed the lowest amount of each charge. If you can’t do that, download statements and start looking at them one at a time for each item and start filling in boxes. Your bank may be able to assist you in speeding up this process. This is different process than reviewing a budget you may have already done.
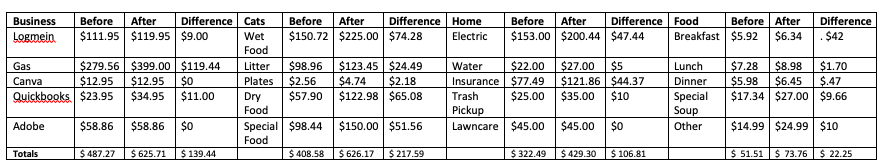
A note to budget nerds: It’s a good starting point to use your budget to set up your buckets and expenses however budgets tend to have ‘budgeted’ amounts. Your bank or credit card statements will have the ‘actual amounts’ which is what we will use here. It may also be a wakeup call to see actual amounts paid vs. what you have budgeted. Here is the spreadsheet with the “before” amounts in place.
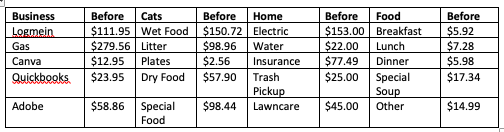
The “before” times look great don’t they? But if we still lived in the “before” times we wouldn’t be in this pinch would we? So what we need is the reason we’re here – the price of things today. I looked on my bank transactions for the points over the 18 months where the prices changed and the highest price / most recently charged. I then added that to the listing.
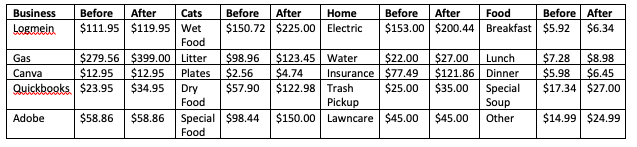
Once we have “before” and “after” we then can begin to see reality set in. Take a deep breath and perhaps a cry. I calculated the difference in each item. You should too.
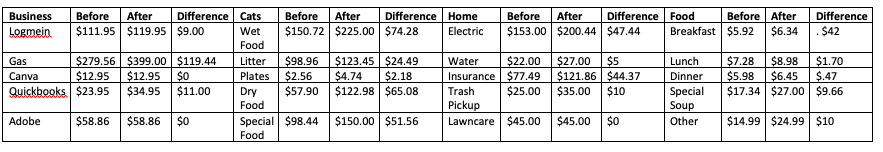
It’s good to see the individual differences but it’s also useful to see the differences bucket-by-bucket. I calculated the difference for each category by totaling the columns. This gives us some quick math but not an inflation rate we can begin to work with.
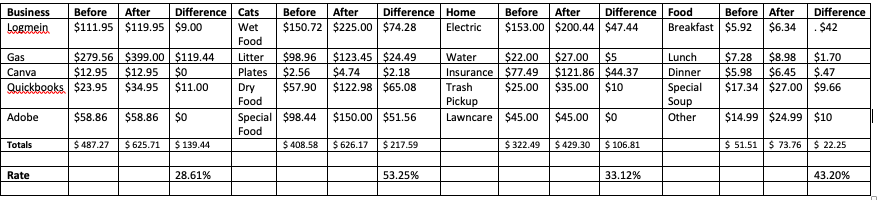
Getting to our own rate is where we want togo. I calculated the individual categories rate of inflation by dividing the difference by the “before” total for each category. This is the math the article by Sharon Epperson explains in detail. Let’s see the rates by bucket.
And finally I added up all the differences and all the “before” amounts to come up with an overall personal rate of inflation. Once again, This is the math the article by Sharon Epperson explains in detail.
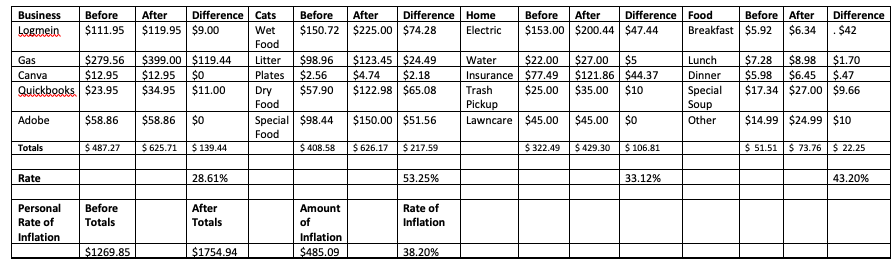
What this process allows you to do is look at several things:
- The rate of inflation for each category
- The amount of inflation for each category
- The rate of inflation overall
- The amount of inflation overall
This isn’t a broad statement from a news report, commentator, analyst or economist. This is your household, your experience, and your life. From here you can begin to make choices and modification to your spending to figure out how to best adjust. This helps avoid “not eating out” to save money if your highest inflation issue is “cat food”. This is your life.
Make adjustments for your own life. It’s better to make adjustments to “Cat food” if you can. That way you aren’t adjusting things that aren’t affected while being hit by things that are continually affecting you. Your sheet may look bigger or smaller and it may take a few tries to catch everything. Once you see where inflation is impacting you the most, you can then begin to journal out ways to change your own behaviors, spends, and routines.
Although I modified these numbers to protect my own privacy, some actions I took in my own life based on my actual numbers included:
- Recognizing gas was a huge part of my personal inflation rate, I cut all non-essential travel and began to focus on reading books at home, consolidating trips for necessities and taking inventory of the supplies I already had on-hand in my home. I cut travel by 90% it seems.
- I began to tell myself, “I can’t have everything I want when I want it and I can’t do everything I want to do when I want to do it.”
- I recognized many young people launched out on their own under a different economy in recent years and this experience may be new to them.
- I recognized that habits take time – 21 days to a new habit as it were is the mantra – and days 1, 2, and 3 would be harder than days 22, 23, and 24. The first few nights staying home would be harder than the 23rd night staying home.
- I recognized that social media could make me envious of friends travellng for vacations, doing more everyday than I can afford to do and told myself that I have to tailor my solution to my situation. I can’t look at everyone else’s situation and be envious.
Now go and look at your numbers and journal out some ways you can make impactful changes to pinch the pinch of inflation – this will be your solution tailored specifically for you – by you.
A few hints for the calculations:
- For gas, you can look up the historical cost of gas in your area in 12/2021 and add up your average miles per month, divide by the miles per gallon your car gets, then multiply by the cost of gas for 12/2021 and repeat for the present day cost of gas.
Example: daily weekday drive is 105 miles roundtrip. Your car gets 28.7 miles to the gallon and gas is $4.69 per gallon. You make this trip 20 days a month. 105 divided by 28.7 multiplied by the cost of gas now multiplied by 20 days = $343.17. Just add in the weekends and you have a number. Re-run the calculation using the old cost of gas, let’s say $3.03 and you get $220.71 (rounded up). Then you subtract $221.71 from $343.17 to get $121.46 as the inflation amount of gas and then divide that by the “before” amount of gas, $221.71 to get the inflation rate of 54.78%.
- For utilities you can look at 6/2022 and then 6/2021 and if usage is the same, subtract the difference and divide by the 6/2021 number. If usage varied it may require a little more calculation. You can also add up Jan-June 2021 and Jan-June 2022 then subtract the totals to get the difference and divide the total difference by the 2021 total to get a rate of inflation then use that to calculate your “after” number for any number you choose to plug in for the specific utility.
Example, if usage is same year-to-year and your 6/2021 bill was $144 and your 6/2022 bill was $174, subtracting the two yields a $30 difference. Divide that difference by the “before” bill of $144 and you get a rate of 20.83% for inflation and use that percentage to project the next few months for this exercise. . You can use that or you can add up Jan-June of 2021 and Jan-June 2022 and do the same calculation to get a percentage for inflation and use that percentage to project the next few months for this exercise.
- This can be as spitball or as accurate as you desire but the more accurate it is, the more accurate the solution will be.
This also puts numbers right in front of you so you can see line-by-line item-by-item what’s happening. It took me roughly two hours to do the expanded version for myself. It took me 3 hours to create these dummy numbers, write this blog, and do some dummy calculations – so this will take time. It is an investment.
The investment is in truth. Once you have it, the truth is staring right in front of you and then you can begin to make adjustments that will both matter and have impact instead of simply trying to cut ‘this’ and ‘that’ hoping it will make a difference. The truth will set you free. This is how you will survive inflation with a solution tailored specifically for you.
Sample File
You may download this Excel file for use locally or import it into Google Docs: https://ronhall.me/docs/inflation-worksheet.xlsx
- Please note that a few of the numbers are different than those used in this article as I was doing the article illustrations by hand and calculating by hand. The Excel file has all the formulas built in and operating – and corrected some of my math.
Works Cited
Epperson, S. (2022, May 13). How to calculate your own personal inflation rate amid rising prices. CNBC. Retrieved July 8, 2022, from https://www.cnbc.com/2022/05/13/how-to-calculate-your-own-personal-inflation-rate-amid-rising-prices.html#:~:text=Add%20up%20your%20monthly%20spending,is%20your%20personal%20inflation%20rate
About the Author

Ron Hall lives in the Middle Tennessee region. He is a graduate of Penn State University. He is active in helping with Ukraine refugees in the war zone, the Hispanic community in Nashville, and animal rescue.